ES110 class consensus
In order to measure visual light profile at various altitudes we used a cosine sensor of ourTR-74UI datalogger. The latter is a device capable of reading and logging light intensity from the sun. The device read the amount of light that our balloon encountered throughout its entire journey. We placed this cosine sensor at the top of our weather balloon box so that it would receive an accurate reading from the sun directly above it.
Written by Kate Weil
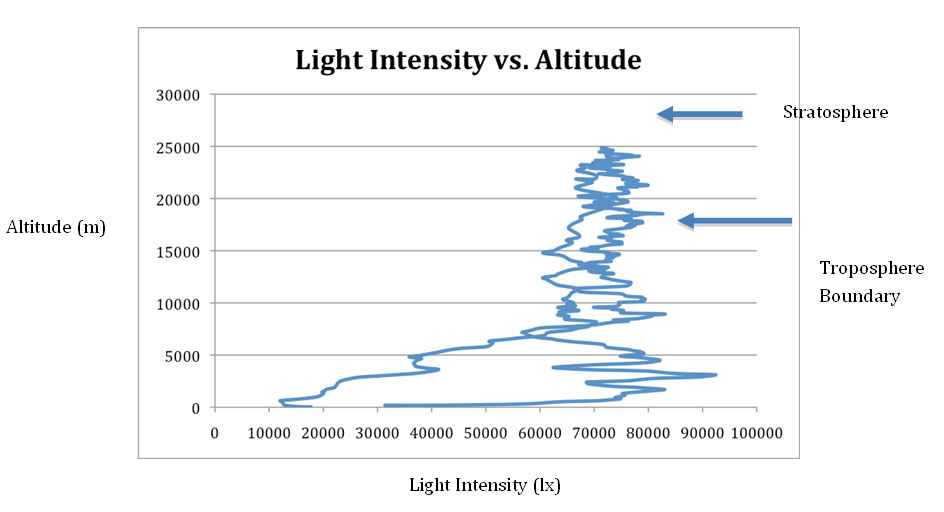
This graph shows the light intensity as measured by the light sensor attached to the outside of the payload container (the insulated lunchbox). The data logger held within the payload recorded the light intensity every 20 secs. We can see that as the balloon rose, the light intensity at first decreased, similarly it decreased dramatically on the way down too – this could be due to the cloud cover that was present on the day of the launch. The intensity varies (the zig-zagging line) while higher in altitude, this may be due to the high wind speeds, causing the payload was swung around and was often under the shadow of the balloon. As expected, the light intensity increased dramatically between 5,000-8,000 m as the balloon rose above the cloud cover and came into contact with full sunlight. Also, the position of the ozone layer at about 13,000 m would have had an impact on the light intensity as it absorbs UV light.
Written by Amy Dwyer
This graph above shows that as the altitude went up so did the light intensity. However, the light intensity did not increase after a certain point and instead fluctuated before decreasing with the altitude.
Written by Kate Gravatt
The light intensity of the balloon fluctuated as the altitude increased. It generally recorded around 7500 lx until it landed, which decreased the light intensity to about 2000 lx.
Written by Rachel Lindsay
From the above graph we can see that there is an overall trend of an increase in altitude leading to an increase in light intensity. Generally, the closer the balloon became to the sun, the stronger the intensity. However, the light intensity does spike early on reaching about 92,000, at the altitude of around 30km. In the lower levels of the atmosphere, specifically the troposphere and part of the stratosphere (the layer that contains the ozone), there are occasional declines in light intensity despite an increase in altitude. The most significant of these can be seen around 49,000 meters, right around when the balloon reached the tropopause, the upper boundary of the troposphere, and entered into the stratosphere. Here, the light intensity decreases from about 79,000 down to 56,000, despite its continual climb in altitude. This could possibly be because there were more interferences within these levels than there were higher up in the atmosphere. For examples, the lower levels of the atmosphere could contain more clouds that would block some of the direct sunlight from reaching the sensor; therefore there were more drastic changes in light intensity averages. Overall however, the light intensity averages fluctuate at a relatively consistent rate throughout the balloons journey.
Written by Kate Weil